Time Series Data
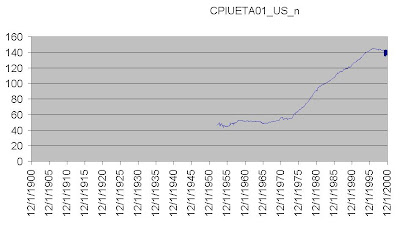
Time Series Data is one of the most common type of data that requires analysis. The above data is a typical example of a time series data (data has been taken from www.freeluch.com). In the graph we can see the variation in the Customer Price Index of US with respect to time. Now, this information would be very interesting from an economic point of view. But how do you go on analysing the data? What different calculations or operations would be required to be performed? Before going into it I would like to share another example of time series data.
The data below (photo of oscilloscope)is taken from one of my previous research on DC motor. The graph shows the variation of voltage across an electric component.

Both of the above examples are the time series data. The data is obviously the output of the system, where an independent variable is being inputted. Now this particular study, is very interesting from the economic point of view and from the signal point of view( in case of electronics). The study of the data reveals the nature of the system and hence allows us to predict or forecast the future value. And this is one of the main reason behind analysis of the time series data.
There are mainly two types of analysis:
Depending upon the nature of the data, the analysis can be chosen. For example, time domain analysis is more important to the economic analysis rather than a frequency domain. But in case of electric signal, both may be useful whereas, in case of others only frequency analysis may be fruitful. So basically it depends.
The reason for the transformation into different domain is that there are certain information about the data that are more visible in one domain than in other.
For example, in order to analyse delay of the system, time domain would be more appropriate than the Frequency domain. Whereas, if bandwidth is the necessary than frequency domain would be more useful to visualize the data.
But I am trying to be unbias and look on the basic of analytics regardless of the system. So lets look at some of the traits of the time series data. Saying that, it would mean that we will be looking more into the mathematics.
When we are analysing the Time Series data, we look at the trend in the data. This means, if either the data is increasing or decreasing and in what rate. We also look at the variation and the rate at which the data is varying. These information provides us insight about the nature of the data. For example, if the data is linearly varying or not?
In the first figure, we can see that the CPI value is almost constant from 1950 to 1975. But then it suddenly starts to rise from 1975 and on 1995 there is again no distinct variation. Now these kind of analysis is different from that of the analysis on the second figure. In second figure, the data is periodic in nature. At the edge, we can see a distinct variation in the magnitude of the data. We call it oscillation in the electric signal terminology. Henceforth, we can see that for different quantities varying with time, the nature of analysis can be different. Though the process is some what similar.
With in the time series data we have two different nature of the data:
Depending upon the type of the data, during the analysis different mathematical concepts are to be used. Also upon different nature of the data variation, different mathematical tools are used. What I mean to say is that the data can be continuous and predictable, the data can be random or chaotic, the data can be discrete and unrelated.
But no matter what the nature is, the fundamental remains same only that it takes different form under different situation.