Analytics Industry
Following is the analysis made Analytics Industry world wide.
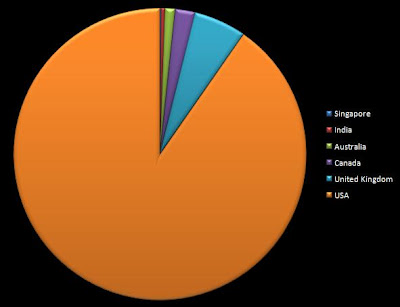
The chart above shows that the 90% of the analytics company is from USA and 6 % from U.K. Whereas India covers only 1 % of the total analytic industry.

This shows that Singapore, India and Australia are very low with respect to the western counterpart. China is not even in the category. Overall, US has the majority of the share.
Analytics in itself is not an industry, it can associate itself with any data intensive industry. Lets look at the industries where analytics is applied.


The above table clearly shows that the major players of analytics are related to the Business Services. Then there are Software & Internet, Health care, Consumer Services, Retail and Financial Services.
Most of the fields like Telecommunication still seems to be unexplored properly. But I assume that with the increase in the telecommunication sector, in near future we might see increasing use of analytics in the those fields too.
Now lets move on to the range of the employees in these analytics industry. The table and the graph shows that the average of employee is around 1 - 100 range. But in some it could increase beyond 100K. This is a great contrast.

Now lets look at the revenue range of these company. The majority of them have a revenue of around $0-10Millions. The distribution of the employee range and the revenue range seems to be correlated with each other. It might also suggest that for a company to increase their revenue it needs to increase its infrastructure and grow big.

All these details on the analytics company shows that the industry is growing and that its penetration is still low in the eastern region of the world. Industry wise, there are many sector which still have not employed analytics as the part of their solution.
Being an analyst and related to analytics field, I would consider the importance of the field is increasing with the rise of information age, where there are millions and millions of data uncovered and unexplored. With so many data floating all around us:
Data for Analyst is as Gold is to Miners.
I hope above presentation was useful.
Note: The Above analysis is based on the data downloaded from http://www.jigsaw.com.
The total record was 725.
